Quick Instructions
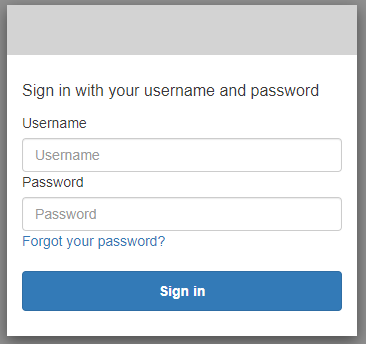
Go to https://events.mi-cie.net/_dashboards and log in.
Once OpenSearch Dashboards opens:
go to the upper righthand corner, and click on the user switcher (labeled with the letter “C”).
click on “Switch tenants”
In the tenant modal/pop-up screen:
click on the radio button labeled “Choose from custom”
if you have access to more than one tenant, select which one you want to view from the dropdown
You will be back on the main OpenSearch Dashboards landing page. From here:
click on the hamburger menu in the upper left part of the screen.
click on “Dashboard”
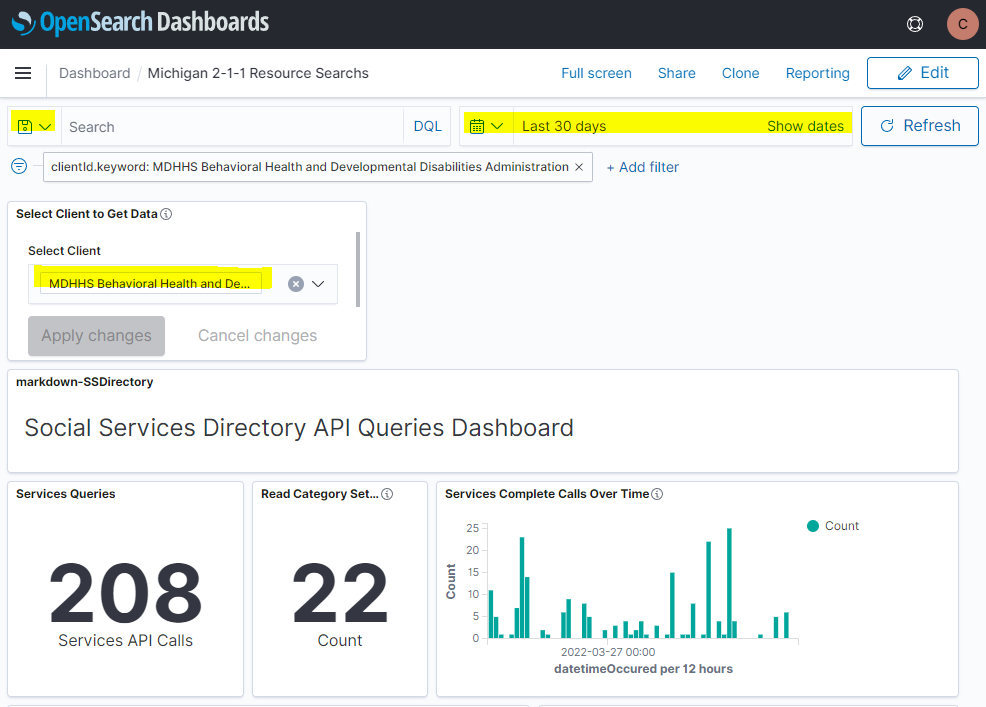
You will see a list of all dashboards in the tenant. You can open any of them.
Depending on the dashboard, you can now alter your view by:
narrowing by saved query
narrowing by client id
altering the time range for the data
Instructions with Screenshots
Go to https://events.mi-cie.net/_dashboards/app and log in.
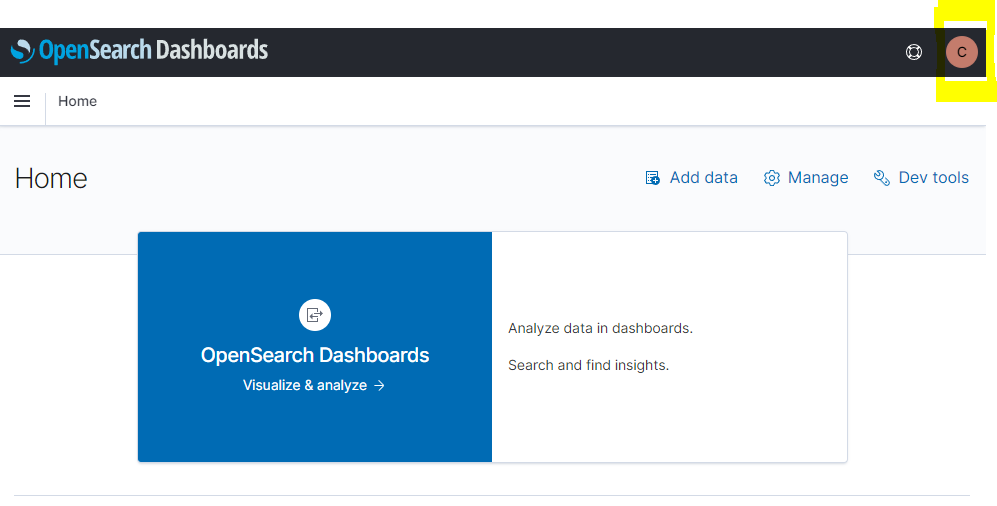
Once OpenSearch Dashboards opens:
go to the upper righthand corner, and click on the user switcher (labeled with the letter “C”).
click on “Switch tenants”
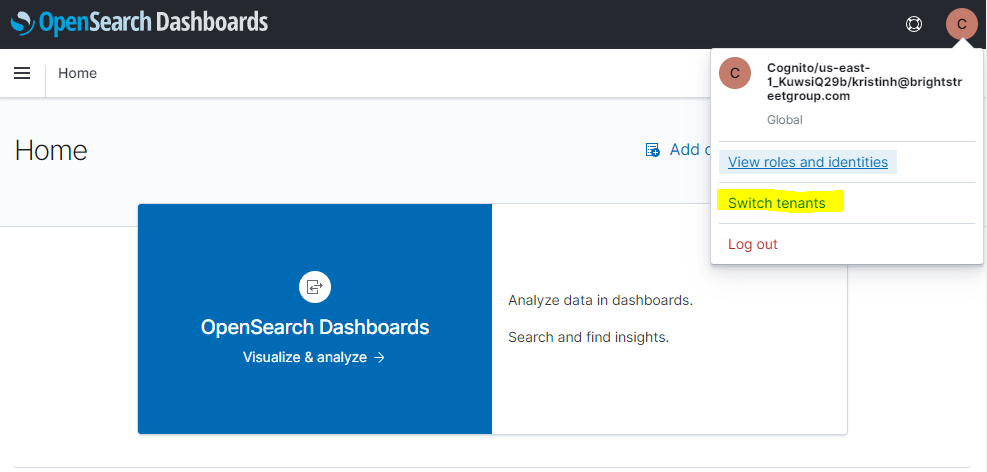
In the tenant modal/pop-up screen:
click on the radio button labeled “Choose from custom”
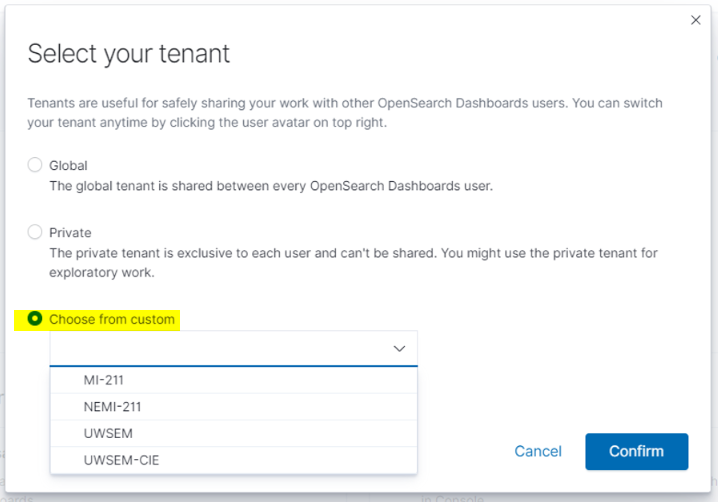
if you have access to more than one tenant, select which one you want to view from the dropdown
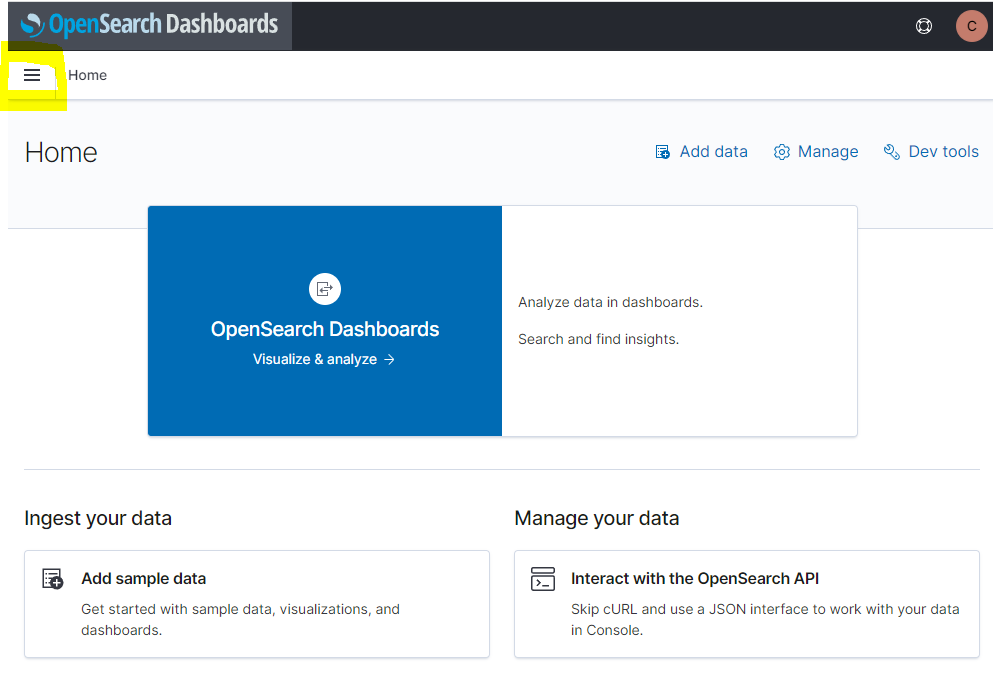
You will be back on the main OpenSearch Dashboards landing page. From here:
click on the hamburger menu in the upper left part of the screen.
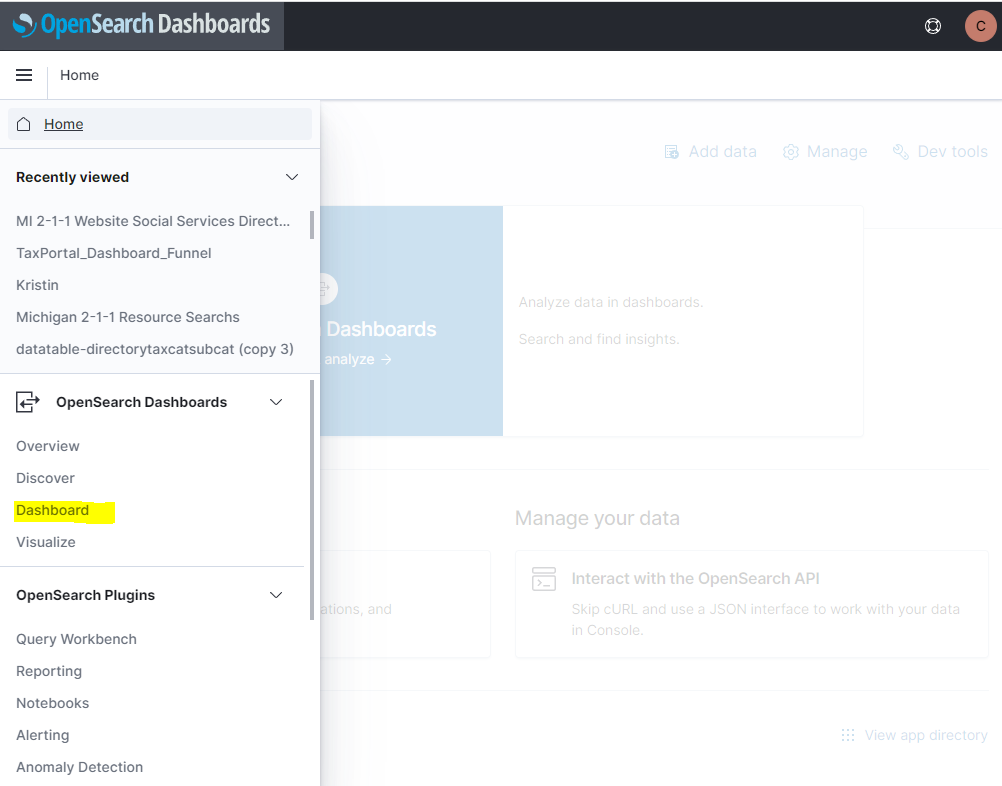
click on “Dashboard”
You will see a list of all dashboards in the tenant. You can open any of them.
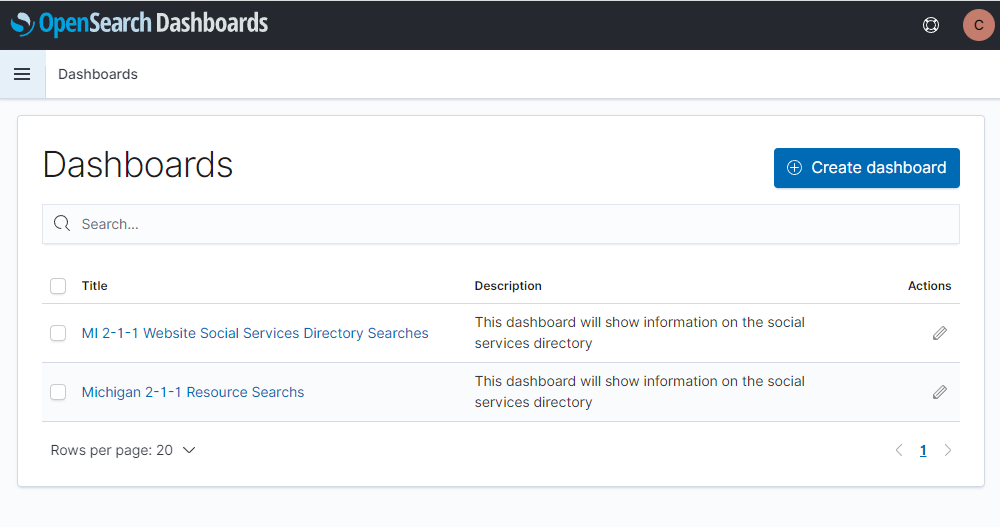
Depending on the dashboard, you can now alter your view by:
narrowing by saved query
narrowing by client id
altering the time range for the data